Truck Operational Report Overview
The Truck Operational Report is designed for larger businesses with a substantial fleet of trucks, enabling them to efficiently track and manage their transportation operations.
This report provides detailed insights into transport counts, crew performance, and truck usage. In this article, the following topics will be covered:
Accessing the Truck Operational Report
This report is located in Custom Export and can be found under the dropdown menu on this page.
Want to follow along in your account? Click here to open the Truck Operational Report in TapGoods PRO!
Customization and Filter Options
The report comes with several filters to help you customize the data according to your needs:
- Transport Date: Select a specific date range to view data for drop-offs, pick-ups, and custom stops within that period.
- Location: Filter by the location of the transport activity.
- Order ID: Narrow down the report to specific orders.
- Order Name: Search for a specific order name to pull related data.
- Truck: Filter by the truck involved in the transport activities.
- Crew Member: View data for specific crew members.
- Crew Role: See information specific to the role of the crew member involved in the transport.
Click on any filter and select the criteria that best fits your needs to drill down into specific data. If you want to clear filters applied, click Clear Filters.
Breakdown of Report Sections
Transport Count
This section gives an overview of the transport activity, including:
- Drop Offs: Total number of drop-offs during the selected time period.
- Pick Ups: Total number of pick-ups during the selected time period.
- Custom Stops: Total number of custom stops made by trucks during the selected time period.
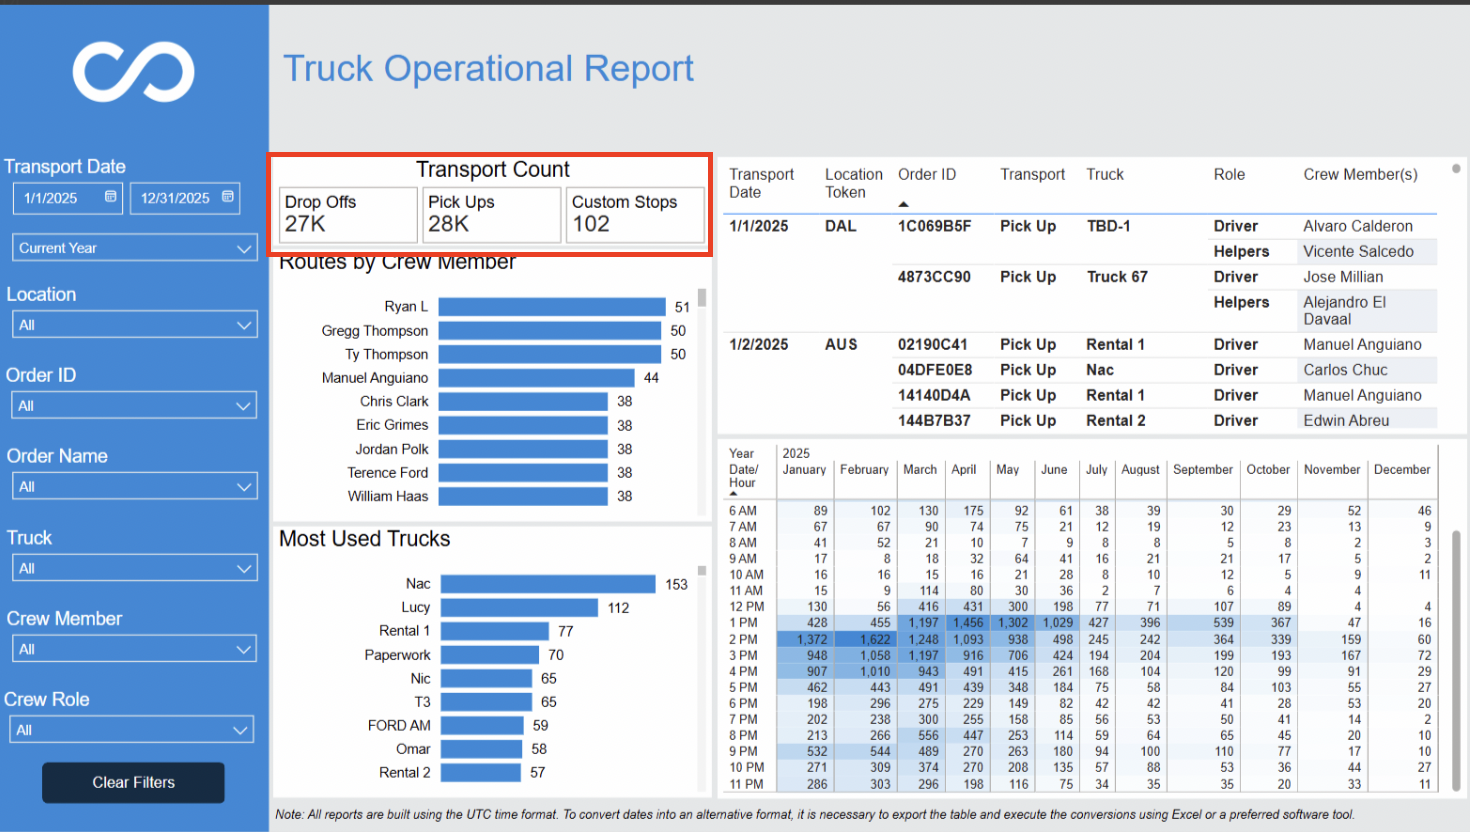
Routes by Crew Member
This section shows the total routes completed by each crew member. It helps track the number of routes each member has been assigned, which can be useful for assessing crew workload and performance.
Here’s a sample of the data you will see:
- Crew members are listed along with the number of routes they’ve completed (e.g., Ryan L, Gregg Thompson, etc.). The data shows the number of completed routes per crew member for better performance tracking.
Most Used Trucks
In this section, you’ll find information about the trucks used most frequently during the selected time period. The trucks are listed in order of usage, with details such as:
- Truck Name: The name or identifier of the truck.
- Usage Count: The total number of times the truck was used in transport activities (e.g., Nac, Rental 1, etc.).
This data helps businesses track the usage of their fleet and identify which trucks are being relied on most.
Detailed Transport Data (Rows)
In this part of the report, you'll see detailed transport data for each day, including:
- Transport Date: The specific date of each transport activity.
- Location Token: A unique identifier for the location associated with the transport.
- Order ID: The ID for the specific transport order.
- Transport Type: Indicates whether the activity was a pick-up, drop-off, or other transport type.
- Crew Members: A list of crew members involved in each transport, including their roles (e.g., driver, helper).
Transport Heat Map
The table at the bottom right of the report shows transport data over a span of months and includes hourly data for detailed tracking. This section provides a visual breakdown of activities on a monthly and hourly basis. Key features include:
- Year and Month Columns: Display the transport activities and totals for each month. You can also dril down to daily
- Hourly Data: The table also includes hourly data for each transport event, allowing users to track the time of day when certain transport activities occur. This is useful for identifying peak operational hours and better managing fleet scheduling.
Related Articles